The History degree vs other degrees: statistics 1900-1935
The University of St Andrews ‘Calendars’, published annually, contained lists of graduating students, with their names and degree subjects. We can use this data to investigate how many people, men and women, graduated in History, and how that changed over time. This provides an excellent backdrop for understanding the experience of female staff and students of history at the university. In this post, we will be contrasting the data we have collected on history students with data from comparable degrees, and the total number of those graduating with MA degrees to gain a deeper understanding of the status of the History degree in the early twentieth century.
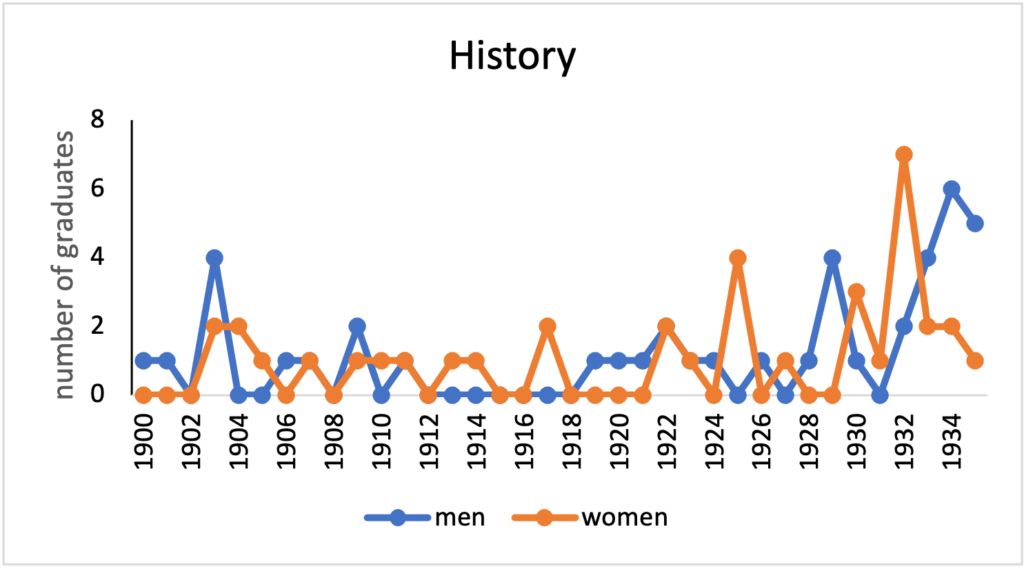
History as an academic subject itself only began to flourish in the late nineteenth century and this is reflected by the very small numbers of those taking history in the beginning of the twentieth century. The first recorded graduation in history was in 1900, and throughout the rest of the decade there was an average of 1.8 graduates a year. This somewhat correlates to the general graduation statistics; at this time was 21 arts graduates a year, meaning that history students made up around 10% of the arts graduates every year. The degree, however, was still relatively young, and subjects like Classics had a much higher number of students.
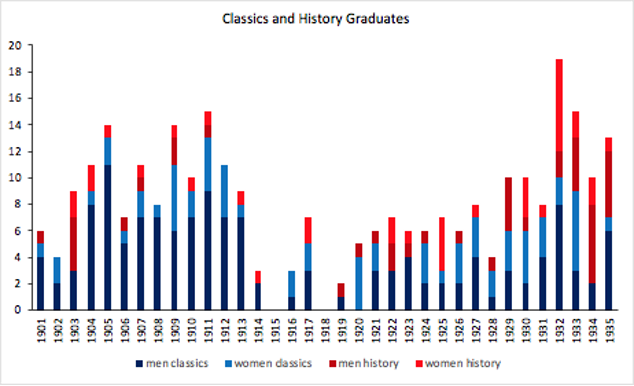
At end of the nineteenth and beginning of the twentieth century Classics was an immensely popular subject and from the years 1890-1900 it reliably made up 40%-70% of total MA graduates. In 1900 it boasted 7 graduates to History’s 1, and in 1910 there were 9 graduates in the subject. It is perhaps the most comparable subject to history, as they covered many of the same subjects and taught students very similar skills.
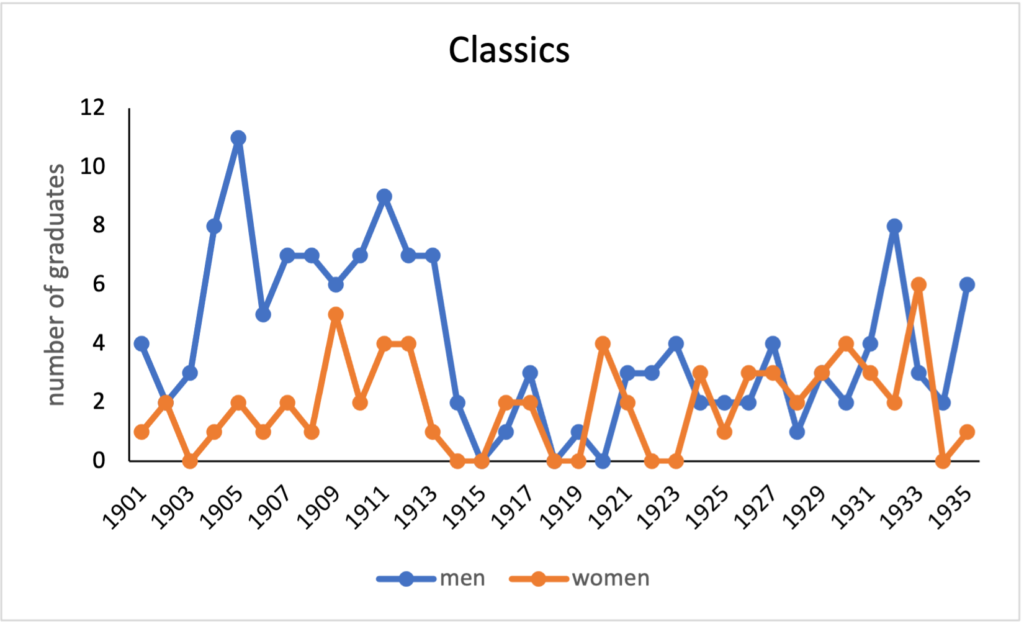
Later in the first half of the century, however, the numbers started to dip. In 1935 there were 7 graduates, the same number as in 1900; in contrast the number of MA graduates in total had increased from 16 to 34, more than doubling. One possible explanation for this stagnation could be the increased popularity of Ancient History, which offered very similar information. In terms of statistics Classics had almost the opposite journey to History, starting with a large number of graduates and stagnating as time went on.
Another comparable degree to History is English, one subject with which there was a lot of crossovers with History. There was a phenomenon the 1920s and 30s of students taking joint honours History-English, one of the first joint history degrees. More information about this degree can be found in a separate blog post.
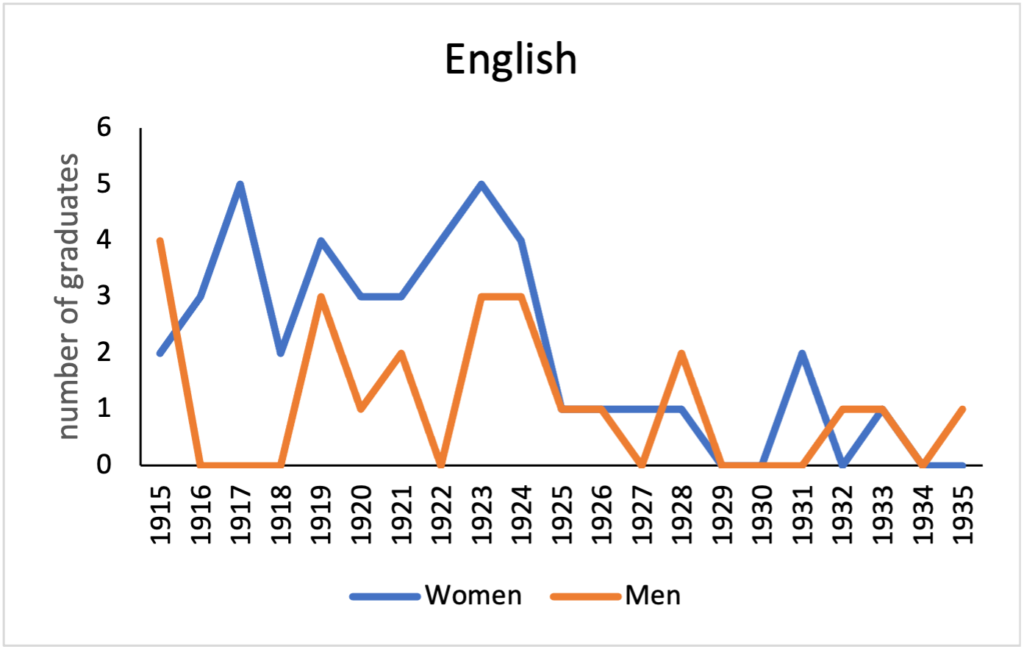
In addition to this, English underwent a fairly similar journey as History as it too started out with a low number of students in the early years and gradually increased over the years. Like History, the first students to graduate with an English degree did so in 1900 and the numbers of graduate remained fairly low during the first decade of the century. From 1900 to 1910 there was an average of 3.6 graduates per year, which is higher than history and lower than classics. This means that on average English graduates made up around 17% of the total MA graduates in the first decade of the twentieth century.
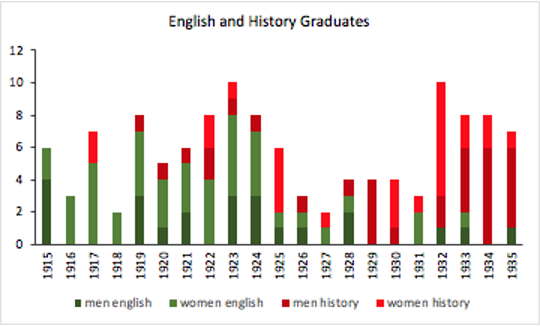
Like Classics, English dipped in numbers as the years went on; in 1935 there was only 1 English graduate and the numbers of graduates had not exceeded 3 in the preceding ten years. History, however, had increased by this period, with 6 graduates in 1935 and an average of 4.1 graduates per year in the same ten-year span.
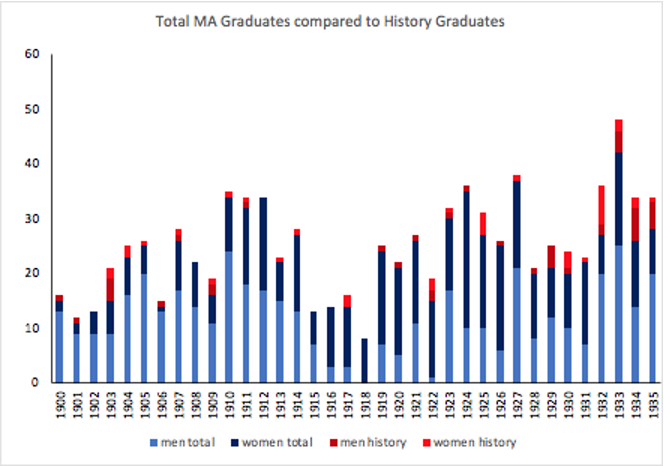
I also think it is interesting to contrast the course of History with that of the number of Master of Arts Graduates in general, which also fluctuated throughout the years. Far from a steady increase, the number of graduates started with 16 in 1900, and generally increased up until the war years of 19-14 where it decreased greatly. The numbers started to rise again and in the first 40 years of the century they peaked with 48 graduates in 1943. The percentage of history graduates in this total number oscillated: it was 13% in 1900, 3% in 1910, 9% in 1920 and 17% in 1930. These numbers may seem low compared to Classics in the early years but in comparison to other years they indicate that the number of History graduates by the 1930s was fairly similar to other subject in the School of Arts. History may have been a small subject in the early years of the century, but as the years went on it gradually increased and became the subject that we know it as today.
Sources: University Calendar 1915-16.
This post was written in 2021 by Amanda Stewart, who was then going into her third year studying history at the University of St Andrews. It was lightly revised by Aileen Fyfe in 2022.
This post is part of a collection examining the establishment of the History degree at St Andrews, looking at the increasing number of staff and students and the gender balance of those graduating with a degree in history. You can also learn about the progression of the history degree in the twentieth century or the or the first joint honours in History. To learn more about the past paper exams from key decades throughout the twentieth century, follow these links: 1905 Past Paper, 1950s Past Paper, 1970s Past Paper, 1980s/90s Past Paper, and the style and format of past history papers.