History graduates: statistics 1900-1975
Just one student graduated with Honours in History in 1900; by 1975, the graduating class had grown to 59 students. We know this, because the University of St Andrews ‘Calendars’, published annually, contained lists of graduating students, with their names and degree subjects. We can use this data to investigate how many people, men and women, graduated in History, and how that changed over time.
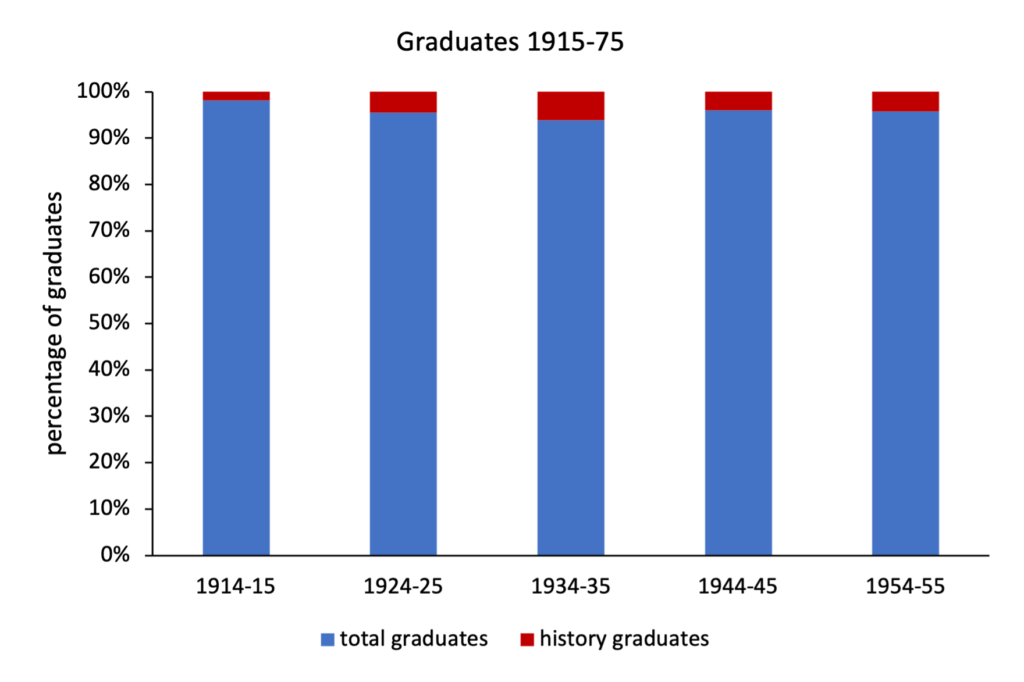
Much as we all love History, the data show that historians were only ever a small proportion of the total number of St Andrews graduates in any year, never exceeding 10% of the total.
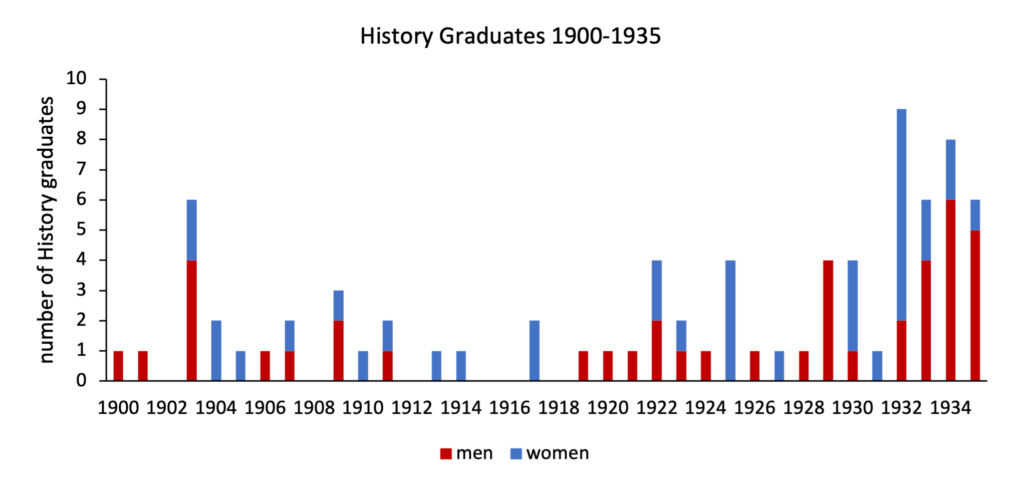
Between 1900 and 1935, there were six years where no one graduated in History at the University. Fifteen other years saw just one individual graduating with a History degree, and in six cases, the sole graduate was a woman. The lack of men History graduates was most notable – if explicable – in the period around the First World War, but there had been previous years (e.g. 1904) when women but no men graduated with Honours in History.
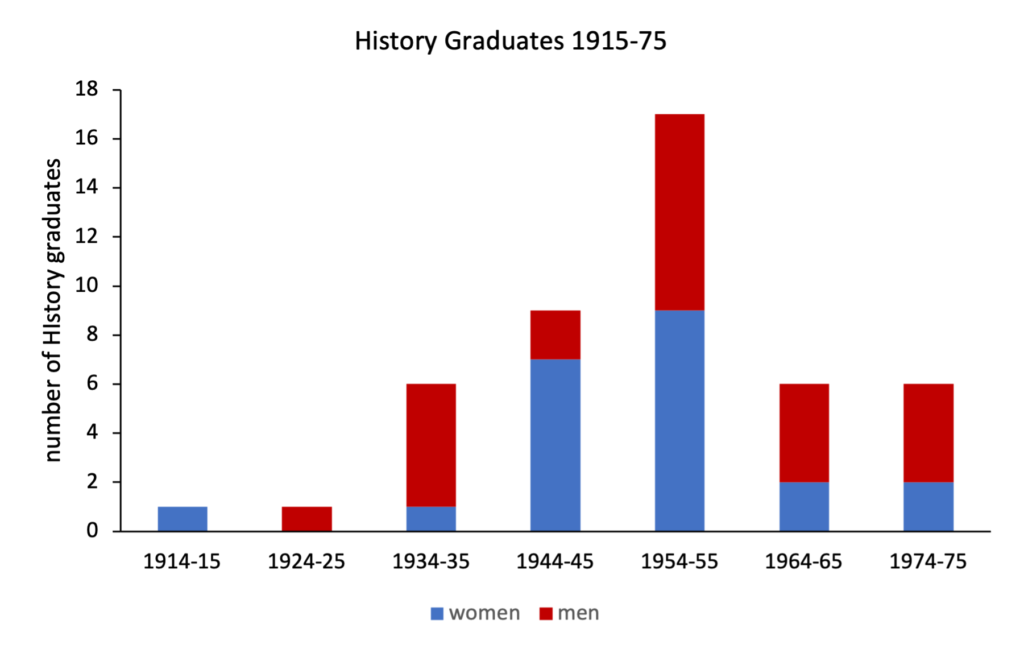
To compare a longer time period, we have taken samples of a year every decade from 1915 to 1975. Over this time, the proportion of women History graduates fluctuated a fair amount: in 1935, just 17% of History graduates were women; but in 1945 and 1955, History graduates were predominantly female (53% and 78% women, respectively); yet by 1965 and 1975, the proportion of women had fallen back to 33%.
One explanation for the female majority in the immediate post-war period might be if the overall percentage of women attending the university in comparison to the number of men had increased. The University Calendars also print statistics on the total number of matriculated students at the University (not just in History), with a gender breakdown. This shows the growth in the student body, particularly from the 1960s (a period of growth in UK higher education more generally).
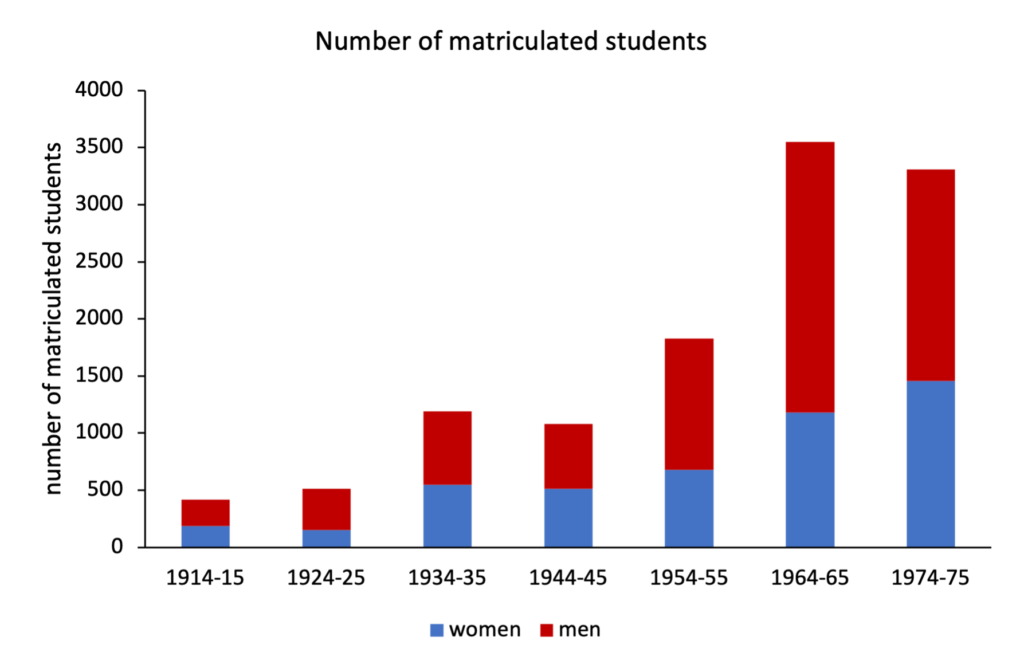
Women came closest to being in a majority of St Andrews students in 1944-45 (with 48%), but this is presumably once more due to wartime conditions. But it’s worth noting that in both 1914-15 and 1975-75, a substantial 44% of St Andrews students were women.
In terms of the impact on History recruitment, however, these overall University trends do not help explain the increased proportion of women among the History graduates in the postwar period – it seems to be related to History, and not to University trends. It may be that the expansion of the department of History in 1945, and then the division into departments of Mediaeval and Modern history, paid off in terms of student recruitment.
Sources: University Calendars 1905-1975.